 TopDissertations


What the Results Chapter Actually Does
You’ve finished collecting and analyzing your data. Now you need to write the results chapter. But here’s the part most guides don’t mention: the results chapter’s defining feature is restraint.
The results chapter has a single job — present your findings systematically, clearly, and without interpretation. That’s it. No explaining why a finding matters. No connecting your results to the literature. No discussing implications. That all happens in the discussion chapter.
Students consistently struggle with this boundary. The University of Southampton notes that 75% of all dissertation writing searches target the discussion section, and the reason is straightforward — the results chapter is where you present data objectively, while the discussion is where you interpret it. Most students find the results section the hardest because they feel compelled to explain their findings before their examiner is ready.
This guide covers both quantitative and qualitative results chapters, with practical APA-style examples, structure templates, and discipline-specific guidance. If you’re at Master’s or PhD level writing a dissertation, thesis, or research paper, you’ll find step-by-step examples and templates for your specific methodology.
- The results chapter’s core principle is restraint — report findings without interpreting them. Save meaning-making for the discussion chapter.
- APA 7th edition now requires effect sizes and confidence intervals alongside every p-value. Reporting only p-values is no longer sufficient.
- Qualitative quotes are evidence, not results — the result is the theme; the quote is the proof. Students often present quotations without analytic commentary.
- Negative cases matter — addressing instances that don’t conform to your themes signals methodological integrity, not weakness.
- You can choose separate or combined structure — quantitative research typically uses separate results and discussion chapters; qualitative and mixed-methods studies often combine them.
How to Structure Your Results Chapter
The structure depends entirely on your research design. There’s no single template that works for everyone, but there are established conventions you should follow.
Separate chapters (Results → Discussion):
- Preferred in quantitative research, especially STEM fields
- Used when you have large datasets, statistical analyses, or multiple independent findings
- Your department or supervisor likely expects this structure
- Best when you need to present raw data objectively before interpreting it
Combined chapter (Results and Discussion integrated):
- Standard in qualitative research, humanities, and mixed-methods studies
- Preferred when findings are narrative, thematic, or exploratory
- The default format at many UK universities for social sciences and humanities
- Best when your findings and interpretations are naturally intertwined
Neither approach is objectively better. The correct choice depends on what your discipline does. Southampton University’s academic skills guide explicitly states that humanities departments expect “an essay-style chapter where results and discussion are intertwined.” Quantitative programs, conversely, typically require the separate-chapters model.
Your first step before writing: Check your department’s guidelines or ask your supervisor directly. Many programs publish explicit structural requirements, and assuming the wrong format is one of the easiest ways to frustrate your examiner.
How to Structure a Quantitative Results Chapter
For quantitative studies, the results chapter follows a clear sequential structure that most supervisors expect. Here’s the standard format:
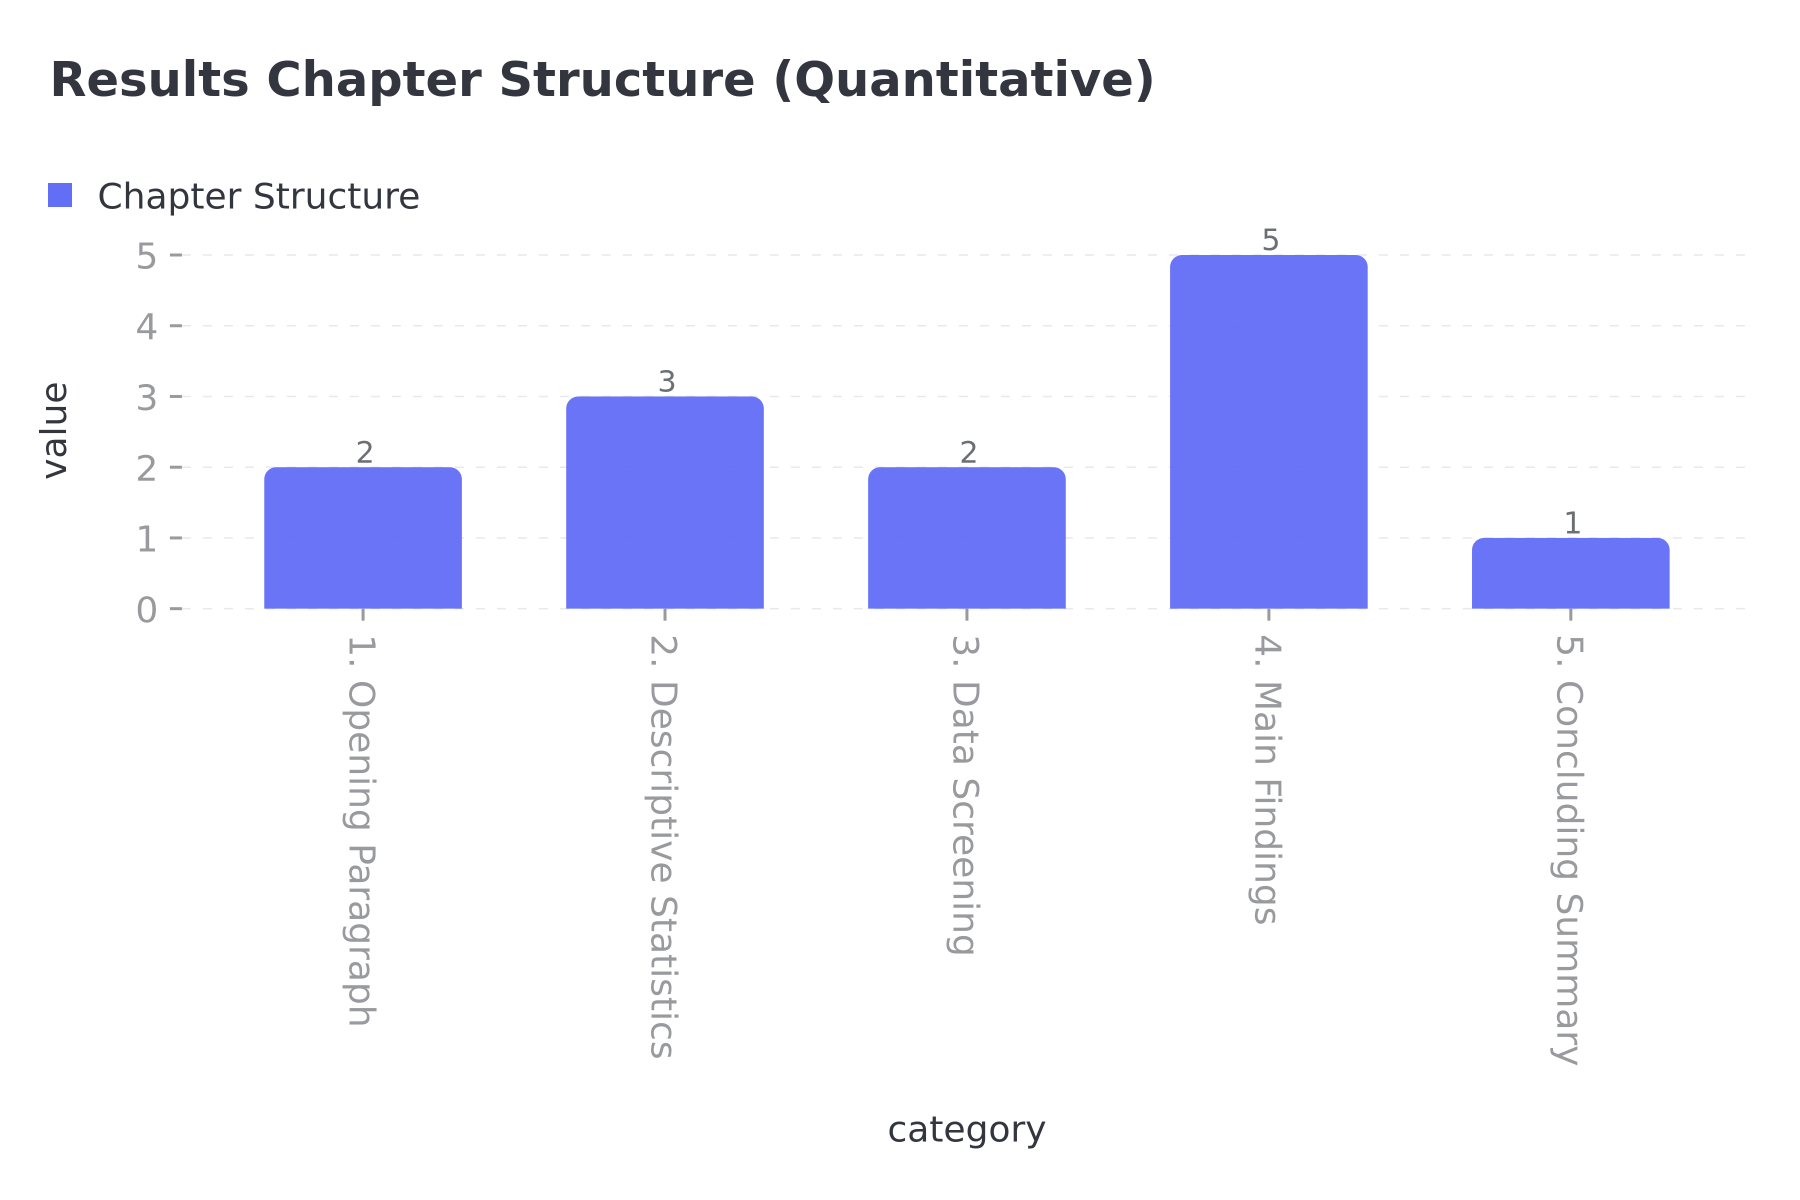
- Chapter Introduction (Brief): 1–2 paragraphs that restate your research questions or hypotheses and provide a roadmap of the chapter’s organization.
- Descriptive Statistics: Report baseline data, sample characteristics, and summary statistics for your variables. This includes means, standard deviations, frequencies, and distributions.
- Data Screening and Assumptions: Report missing data, outliers, tests for normality, and composite measure internal consistency (e.g., Cronbach’s alpha).
- Hypothesis Testing: Address each research question or hypothesis systematically using descriptive statistics followed by inferential tests.
- Concluding Summary: A short, neutral summary of key findings that transitions into the discussion chapter.
How to Structure a Qualitative Results Chapter
For qualitative studies, the results (often called “findings”) chapter follows a thematic structure:
- Chapter Introduction: Restate your qualitative research aims, questions, and the thematic framework.
- Thematic Sections: Group findings by distinct themes or categories using descriptive headings. Provide rich verbatim participant quotes (at least two per claim) to substantiate each analytical point.
- Negative Cases: Address instances that don’t conform to emerging themes. This signals methodological rigor.
- Concluding Summary: Recap the core themes directly tied to your research questions while keeping the text strictly descriptive.
APA Style Reporting: How to Present Quantitative Data
APA 7th edition changed the landscape for quantitative results reporting. The standards you need to follow are set by the American Psychological Association’s Journal Article Reporting Standards (JARS), which provide distinct guidelines for reporting quantitative, qualitative, and mixed methods results to ensure transparency and methodological integrity.
Key APA reporting rules for quantitative results:
- Report exact p-values to two or three decimal places (e.g., p = .032 or p = .008), with values below .001 reported as p < .001 — never as p = .000. The CASRAI guide on p-value reporting emphasizes that a p = .000 is a formatting error, not a correct exact value.
- Drop the leading zero for statistics bounded between 0 and 1 (like p-values, correlation coefficients, and proportions): write p = .032, not p = 0.032.
- Use a space around equals or inequality signs: p = .032, not p=.032.
- Italicize statistical symbols: t, F, p, r, χ².
- Report effect sizes and confidence intervals alongside every inferential test. APA’s Publication Manual (7th edition, 2020) and JARS direct authors to report an effect-size estimate — and a confidence interval around it wherever possible — alongside every inferential test.
Reporting p-Values Correctly
There are two ways to report statistical significance:
- Exact-value reporting states the actual computed p-value: “the difference was significant, p = .032.” This preserves the actual strength of evidence against the null and lets a reader, or a later meta-analysis, use the real number.
- Threshold reporting states only whether a result crossed a pre-set cutoff: “the difference was significant, p < .05.” APA’s current guidance treats exact-value reporting as the expected default for any p-value above .001.
The CASRAI guide on p-value reporting explains why exact values are now preferred: threshold reporting was a legacy of an era when p-values were looked up in printed tables at fixed cutoffs (.05, .01, .001) rather than computed exactly by statistical software. Once software reports an exact value as a matter of course, rounding it to “< .05” discards information the analysis already produced.
The most common statistical reporting error: Students write “p = .000” instead of “p < .001.” Some statistical software packages round very small p-values down to three decimal places and display them as “.000” in the output table. Copying that directly into a manuscript is a reporting error. A p-value is a continuous probability and is mathematically never exactly zero, even when it is extremely small.
Reporting Effect Sizes and Confidence Intervals
A p-value alone tells you almost nothing about whether a finding matters. A very small effect can produce a very small p-value given a large enough sample, and a real, meaningful effect can fail to reach conventional significance in a small or underpowered study.
APA 7th edition requires you to report:
- Test statistic with degrees of freedom (e.g., t(48) = 2.74)
- Exact p-value (e.g., p = .009)
- Effect size appropriate to the test (e.g., Cohen’s d, r, η², Cramer’s V)
- Confidence interval around the effect size (conventionally 95%)
Here are APA-style templates for common tests:
Independent-Samples t-test:
There was a significant difference between groups, t(48) = 2.74, p = .009, d = 0.78, 95% CI [0.18, 1.38].
One-Way ANOVA:
A significant effect of condition was found, F(2, 87) = 5.23, p = .007, η²p = .11, 95% CI [.02, .22].
Pearson Correlation:
Variables were positively correlated, r(98) = .35, p = .002, 95% CI [.16, .52].
Multiple Regression:
Age predicted performance, b = −0.03, p = .014, 95% CI [−0.05, −0.01].
Chi-Square Test:
Outcomes differed by group, χ² (3, N = 312) = 14.72, p = .002, Cramer’s V = .22, 95% CI [.08, .36].
Reporting Qualitative Results Correctly
Qualitative results reporting follows different standards outlined in APA’s Journal Article Reporting Standards for qualitative research (JARS-Qual). The core principles include:
- Reflexivity: State your own standpoint, background, or potential biases in relation to the data. JARS-Qual requires you to document your positionality, as it shapes how you interpret themes and categories.
- Theme development: Explain step-by-step how you built codes, categories, or themes from the raw text. Report your coding process transparently so readers can follow your analytic logic.
- Methodological integrity: Show how your methods match your goals, ensuring fidelity to participant experiences and the utility of findings.
- Quotes are evidence, not results: The result is the theme; the quote is the proof. Present quotes to illustrate each theme, then add analytic commentary that connects the quote back to your research question. Never present a quotation without interpretation.
- Report negative cases: Include instances that don’t conform to emerging themes. This is a mark of methodological integrity, not weakness. As Grad Coach emphasizes, “How to test a theme, and how to defend it” requires you to address contradictory or unexpected data points explicitly.
Here’s an example of a well-written qualitative results section:
Theme 1: Overwhelming but Motivating
The most consistent theme across interviews was the tension between difficulty and motivation. Participant 7 described the experience as “overwhelming but motivating” (Interview 7, line 42). This aligns with motivation theory’s emphasis on self-efficacy (Bandura, 1997), suggesting that perceived competence — not just external rewards — drives student persistence. However, this contradicts the findings of Smith (2019), who found that extrinsic incentives were the primary motivator in their sample. The discrepancy may stem from the qualitative nature of this study, which captures nuanced personal experience rather than aggregate trends.
Participant 12 echoed this pattern: “I wanted to quit every day, but I also knew I couldn’t stop.” This suggests a persistent commitment that operates independently of enjoyment or external reward. Two of three participants in this cohort described experiencing the same tension, indicating a robust pattern.
Negative case: Participant 3 reported a purely negative experience (“I didn’t feel motivated at all, and I didn’t find the workload challenging enough to care”), which doesn’t fit the broader pattern. This case is consistent with the literature on academic disengagement (Traynin & Eriksen, 2017), suggesting that the theme may not generalize to students who already feel disconnected from their program.
The Restraint Principle: What Belongs in Each Chapter
The single most common student anxiety around results chapters is knowing where to stop reporting and start discussing. This is where your understanding of the restraint principle becomes essential.
The restraint principle states: the results chapter presents findings systematically; the discussion chapter interprets meaning. Here’s a comparison table that clarifies what belongs in each section:
Results Chapter vs Discussion Chapter: What Belongs Where
| Criterion | Results Chapter | Discussion Chapter |
|---|---|---|
| Purpose | Present findings objectively | Interpret meaning and implications |
| Tense | Past tense (“the analysis showed…”) | Present tense (“these findings suggest…”) |
| Interpretation | No interpretation, no explanation | Full interpretation, theoretical connections |
| Literature | Do not cite prior studies | Compare findings to prior research explicitly |
| Language | Neutral, descriptive language | Analytical, evaluative, speculative language |
| Statistics | Report test statistics, p-values, effect sizes | Discuss practical significance, effect magnitude |
| Quotes | Present verbatim quotes as data | Interpret quotes in relation to theory |
| Implications | Do not discuss limitations or implications | Discuss limitations, implications, future research |
| Transitions | Conclude with a neutral summary | Open with a high-level restatement of key findings |
Concrete Examples
What to write in Results:
A one-way between-subjects ANOVA revealed a significant effect of condition on performance, F(2, 87) = 5.23, p = .007, η²p = .11. Post-hoc comparisons using Tukey’s HSD test indicated that Group A differed significantly from Group C (p = .003), but not from Group B (p = .47).
What to write in Discussion:
These findings suggest that Condition A produced higher performance than Condition C, which aligns with the self-determination theory prediction that autonomy-supportive environments enhance task engagement. However, the lack of difference between Group A and Group B may indicate that the intervention’s benefits plateau at a certain intensity level — a possibility worth exploring in future studies.
The distinction is clear: the results section reports what the data showed; the discussion section explains what the data means.
When to Choose Separate vs Combined Structure
You’ve seen the two structural options above. Here’s a practical decision framework:
- Check department guidelines first — this is always step one. Follow them if present.
- Your discipline convention — humanities/qualitative → combined. STEM/quantitative → separate. Mixed methods → ask your supervisor.
- Your data volume — large datasets with many analyses → usually separate. Narrative or thematic findings → usually combined.
- Your examiners’ expectations — read recent dissertations from your department. Mimic the format of high-scoring work.
- Your chapter length — if a combined chapter exceeds 60 pages, splitting is likely practical regardless of convention.
Common Mistakes (and How to Fix Them)
Mistake 1: Reporting p = .000
Problem: Copying SPSS output directly without recognizing that “.000” is a software display artifact, not a real p-value.
Fix: Report any value below .001 as p < .001. Check whether your software can display more decimal places or scientific notation before assuming .000 is the true value.
Mistake 2: Presenting Quotes Without Interpretation
Problem: Students often present a quotation and let the reader infer the connection. The quote is evidence, not the finding itself.
Fix: Every quote should be followed by analytic commentary that explicitly connects it to the theme and research question. Think of it as claim → evidence → commentary.
Mistake 3: Reporting Effect Sizes Only When Significant
Problem: Some students report effect sizes and confidence intervals only for statistically significant results, omitting them for non-significant findings.
Fix: Report effect sizes and confidence intervals for every inferential test, regardless of significance. This is required by APA 7th edition and JARS.
Mistake 4: Blurring Results and Discussion
Problem: Interpreting findings in the results chapter or restating results in the discussion without adding new insight.
Fix: Keep a strict boundary. Use the restraint principle as your checklist. If you’re explaining why a finding matters, it belongs in the discussion.
Mistake 5: Ignoring Negative Cases in Qualitative Work
Problem: Focusing only on findings that confirm emerging themes and sidestepping contradictory cases.
Fix: Give negative cases equal attention to supporting cases. This is what JARS-Qual expects and what examiners look for to assess methodological rigor.
Results Chapter Structure Flow
Here’s a visual guide to the sequential organization of your results chapter, from opening paragraph through hypothesis reporting to the summary sentence:
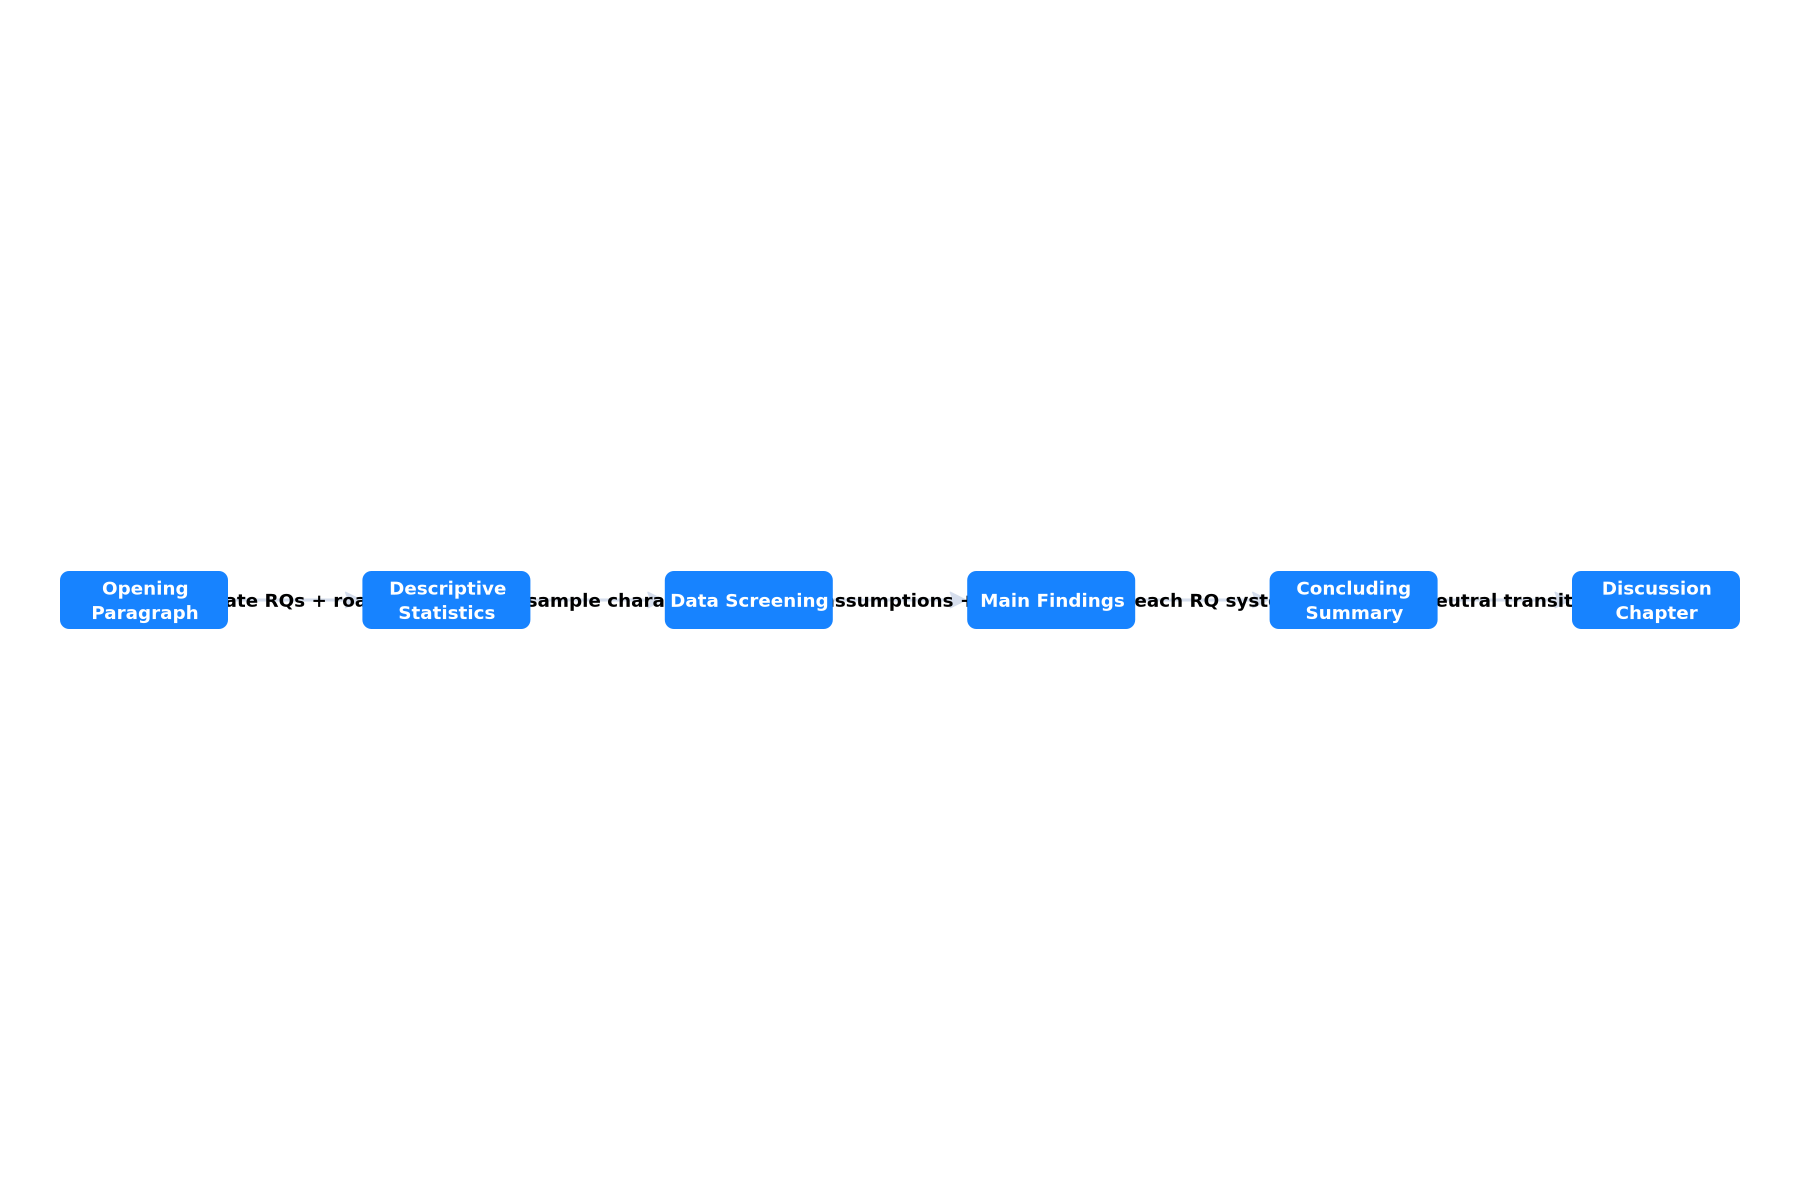
The flow moves through five key stages:
- Opening paragraph → Restate research questions and provide chapter roadmap
- Descriptive statistics → Sample characteristics, variable summaries
- Data screening → Missing data, outliers, assumptions checked
- Main findings → Address each research question systematically
- Concluding summary → Neutral high-level summary transitioning to discussion
Quantitative Results Structure
For quantitative studies, the chapter follows a clear sequence that supervisors expect:
What To Do Next
You now have a clear framework for writing a results chapter for both quantitative and qualitative studies. The key takeaway is restraint — present findings objectively, report them using APA-style formatting, and leave interpretation for the discussion chapter.
Before you start writing, confirm your department’s structural expectations. This single question prevents the most common formatting mistake.
If you need support with presenting results, interpreting findings, or choosing between combined and separate formats, our team of qualified academic writers can help. You can place an order for individual chapters or request direct communication with a writer who matches your discipline and research area.
References and Further Reading
For additional guidance on writing your results chapter, consider these resources:
- Grad Coach: Quantitative Results Analysis — Step-by-step guide for quantitative results with free template
- Grad Coach: Qualitative Results and Findings — Qualitative results structure with examples
- APA Style Journal Article Reporting Standards (JARS) — Official quantitative and qualitative reporting standards
- CASRAI Guide: How to Report P-Values — Formatting conventions for p-values, effect sizes, and confidence intervals
This article covers the separate results and discussion format. If your department requires a combined results-and-discussion chapter, you’ll find dedicated guidance in our combined results chapter guide.
<parameter=filepath> seo-content/results-chapter-guide.md
</parameter=filepath>
